Today I learned about the Splunk SIEM and how it is used by SOC analysts to collect, store, and analyze security logs. Rather than being a single tool, Splunk is made up of several components that work together to turn raw logs into searchable events.
The three core components of Splunk
At a high level, Splunk is built around three main components. Understanding how data flows between them is key to understanding how Splunk works as a SIEM.
Forwarder
The forwarder is responsible for collecting logs from endpoints and systems. It runs on hosts and sends log data to Splunk for processing.
In a real environment, forwarders may collect logs from servers, workstations, network devices, or applications and forward them securely to the indexer.
Indexer
The indexer receives data from forwarders and performs normalization and indexing. It processes incoming logs and stores them in an index database so they can be searched efficiently.
This is where raw log data becomes structured, searchable events.
Search Head
The search head is the interface analysts interact with. It allows users to search through indexed data, build dashboards, and investigate security events.
When you run a search in Splunk, the search head queries the indexers and returns matching events.
Searching in Splunk using SPL
Splunk uses a dedicated query language called the Search Processing Language (SPL). SPL allows analysts to search, filter, and transform large volumes of data.
With SPL, you can:
- Search for specific events
- Filter logs by time, source, or field
- Extract useful fields from raw data
- Summarize and visualize results
SPL is central to day-to-day SOC work in Splunk-based environments.
Exploring the Splunk interface
I also explored different parts of the Splunk interface to understand how analysts navigate the platform.
- App bar – used to switch between installed Splunk apps
- Explore Splunk – entry point for searching and learning features
- Dashboards – visual summaries of indexed data and alerts
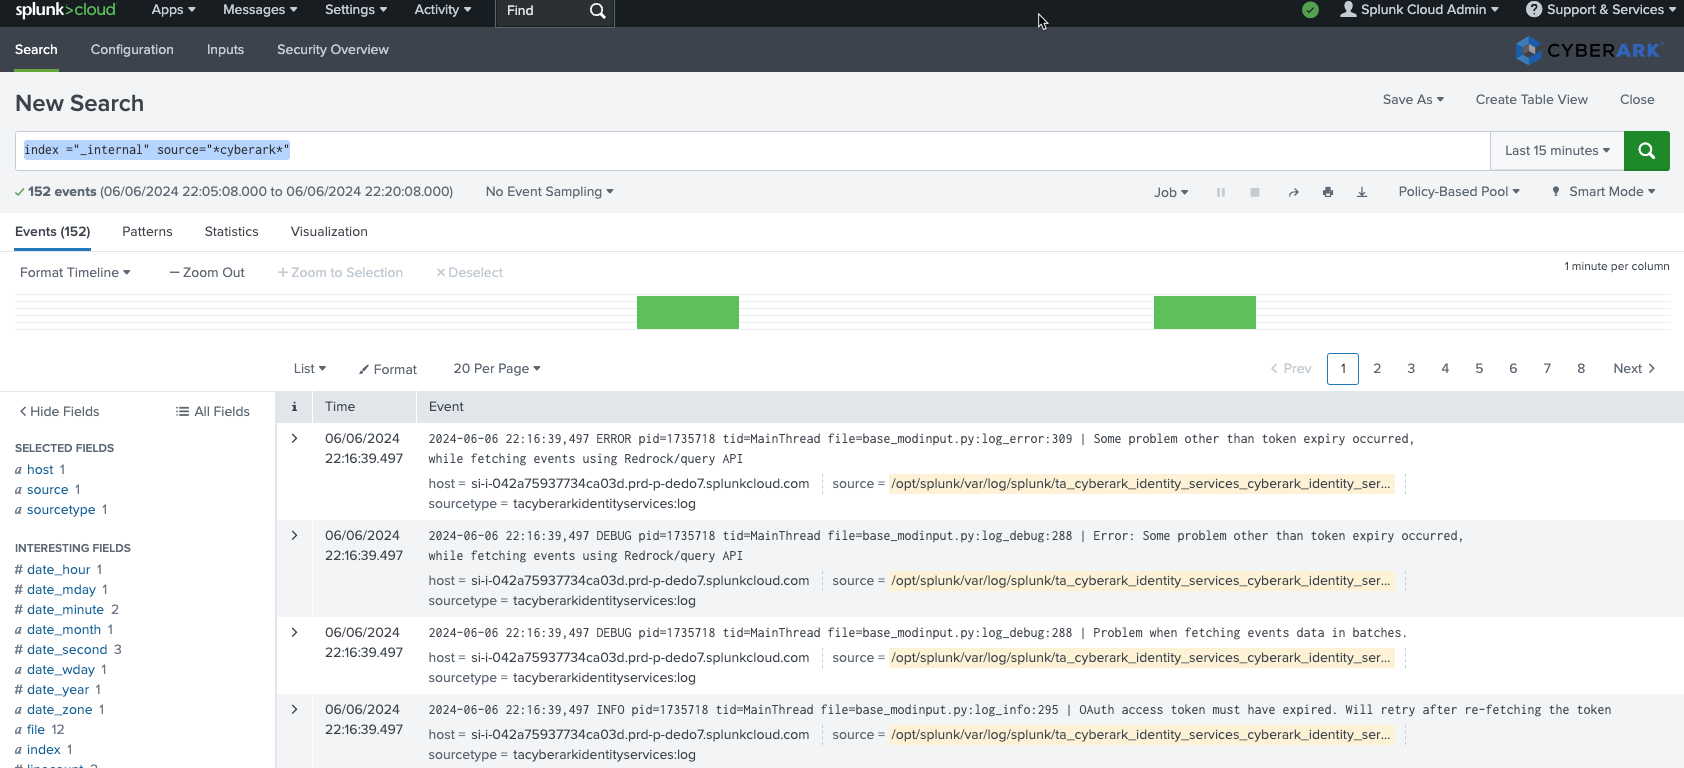
- Search – the main workspace for running SPL queries
These components are designed to help analysts move quickly from raw data to meaningful insights.
Hands-on lab: importing VPN logs
To reinforce the concepts, I completed a small hands-on lab using Splunk. In this lab, I imported VPN logs into Splunk, created a new index, and used SPL searches to find specific events.
This helped me understand:
- How data is ingested into Splunk
- How indexes are created and used
- How searches return matching events from indexed logs
Even with a simple dataset, it became clear how powerful centralized searching can be when dealing with large volumes of log data.
Key takeaway
Learning Splunk made the flow of data in a SIEM much clearer. Forwarders collect logs, indexers process and store them, and the search head gives analysts the tools to investigate.
Combined with SPL, Splunk provides a practical way for SOC analysts to detect suspicious activity, investigate incidents, and understand what is happening across an environment.

No comments yet.